Every location
Worst air first.
When smoke is moving, the question is who is getting hit. Every place we forecast, ranked by how bad it gets in the next day. The number is the US air quality scale — under 50 is clean, over 100 is worth taking seriously.
Open any location for its full forecast →
Prototype run. This build is generated from the captured fixture, whose tiles hold only forecast hours 1, 12, 13 rather than every hour. A production run publishes dense tiles and this page renders 24 columns.
- Prineville, OR273peak · Very UnhealthySee the forecast
- Wenatchee, WA144peak · Unhealthy for Sensitive GroupsSee the forecast
- Ellensburg, WA134peak · Unhealthy for Sensitive GroupsSee the forecast
- Sisters, OR122peak · Unhealthy for Sensitive GroupsSee the forecast
- Nampa, ID113peak · Unhealthy for Sensitive GroupsSee the forecast
- Meridian, ID96peak · ModerateSee the forecast
- Redmond, OR96peak · ModerateSee the forecast
- Selah, WA81peak · ModerateSee the forecast
- Boise, ID80peak · ModerateSee the forecast
- Yakima, WA73peak · ModerateSee the forecast
- Bend, OR69peak · ModerateSee the forecast
- Mount Rainier National Park54peak · ModerateSee the forecast
- Miami, FL34peak · GoodSee the forecast
- Hialeah, FL33peak · GoodSee the forecast
- Kendall, FL31peak · GoodSee the forecast
- Everglades National Park28peak · GoodSee the forecast
What you are looking at
Plain answers, from public data.
Wildfire smoke is forecast the same way rain is. Here is where the numbers come from and what they mean.
Who measures it
NOAA, the US weather service.
The same government agency that forecasts hurricanes runs a smoke model for the whole country. It updates every hour and it is free and public. Smaze reads it and does nothing to it except make it readable.
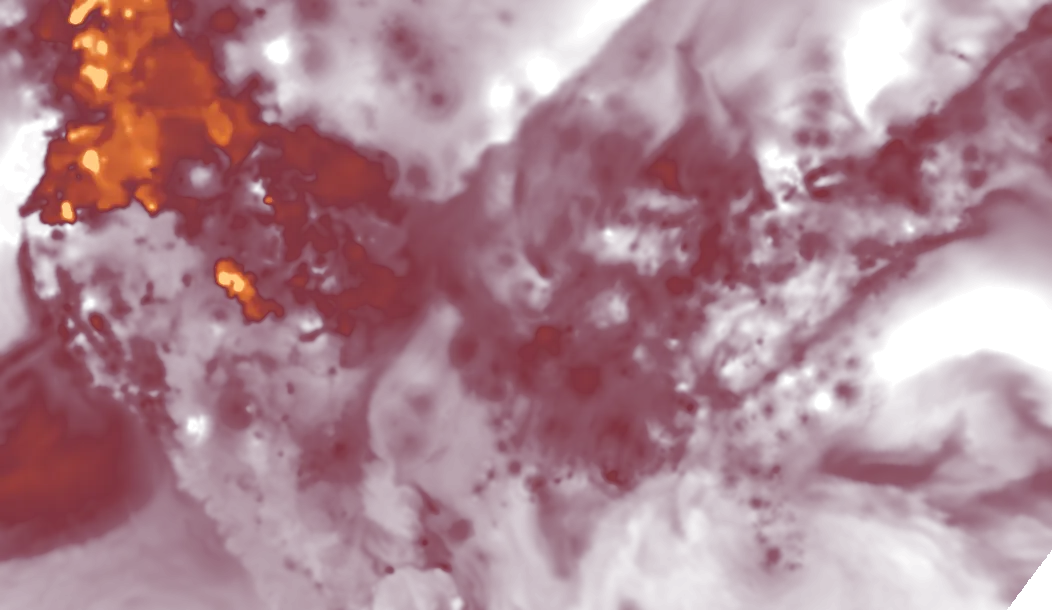
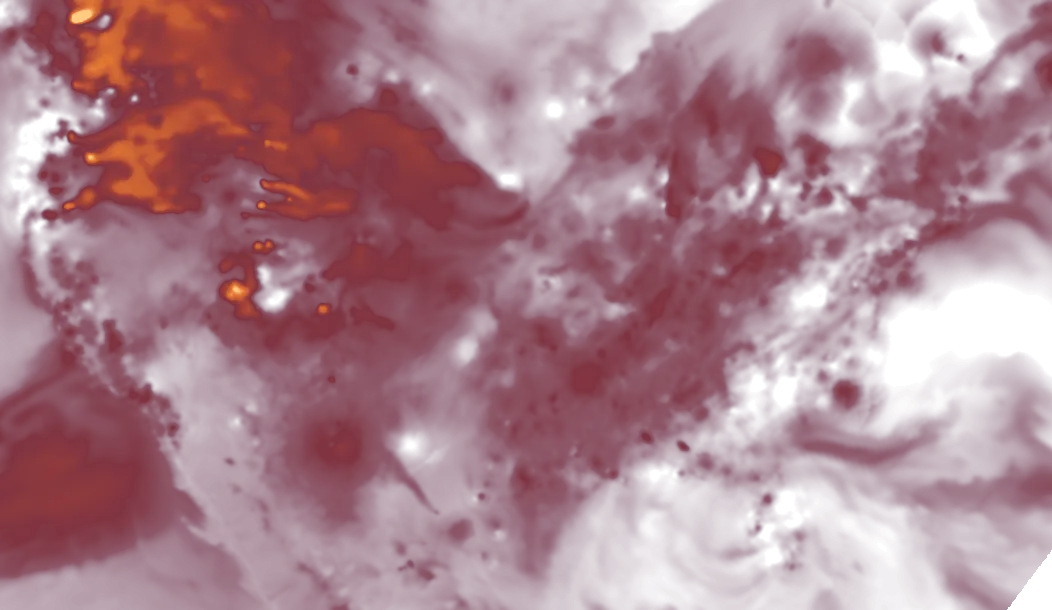
This map: NOAA NDGD for smoke, NOAA HRRR for wind. Fire locations come from NIFC and are an app feature.
What it shows
Two different things.
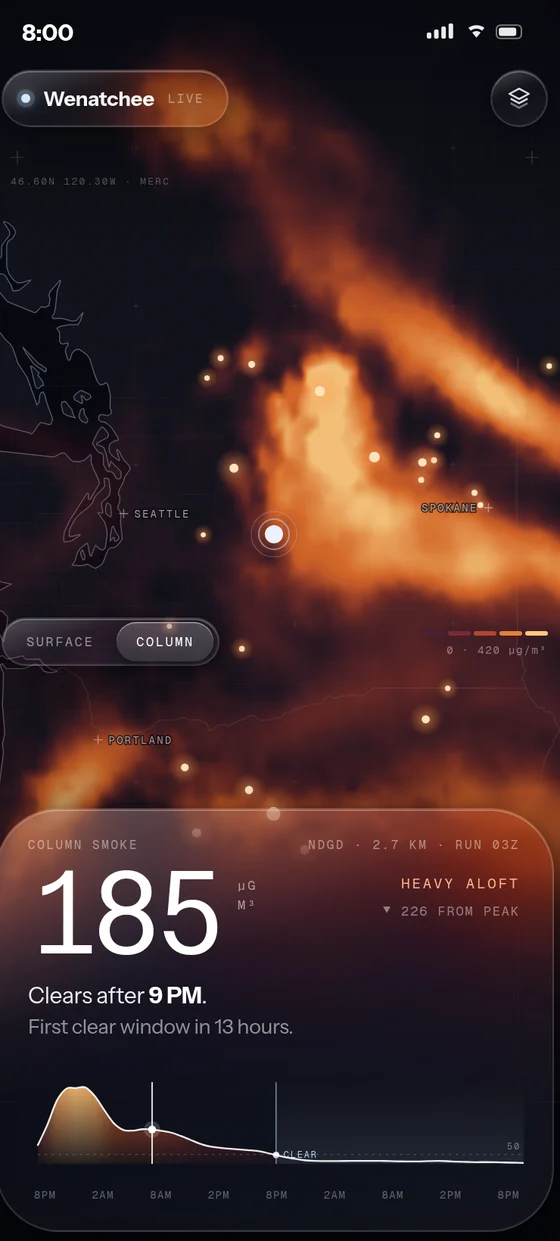
Air quality is the smoke down where you breathe. That is the number that matters for going outside.
Sky smoke is all the smoke above you, all the way up. That is why the sun can look orange on a day the air is fine.
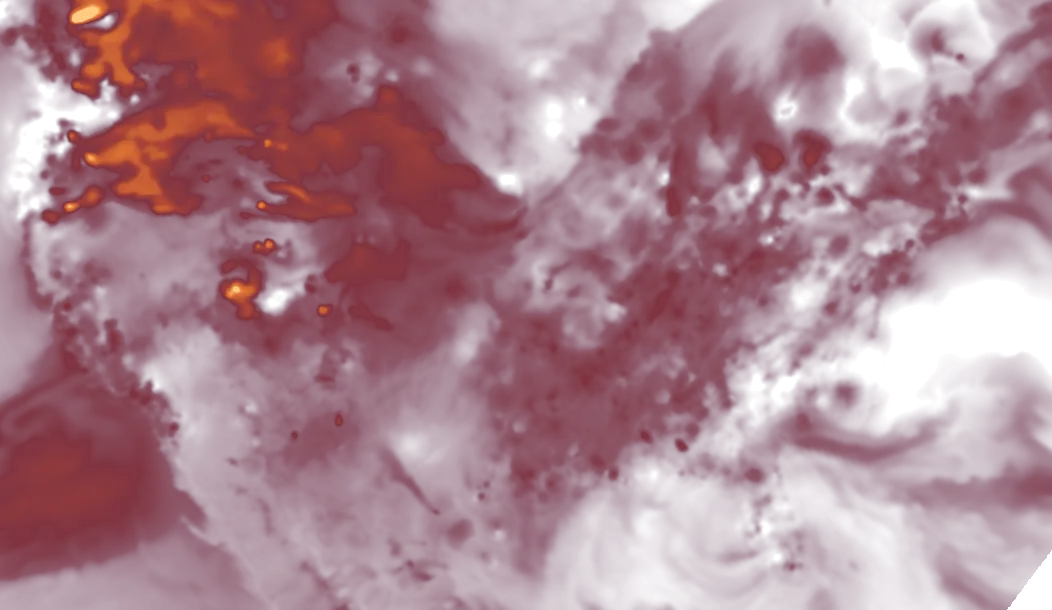
Surface PM2.5 in micrograms per cubic metre, and total column smoke in milligrams per square metre.
How to read it
Brighter means more smoke.
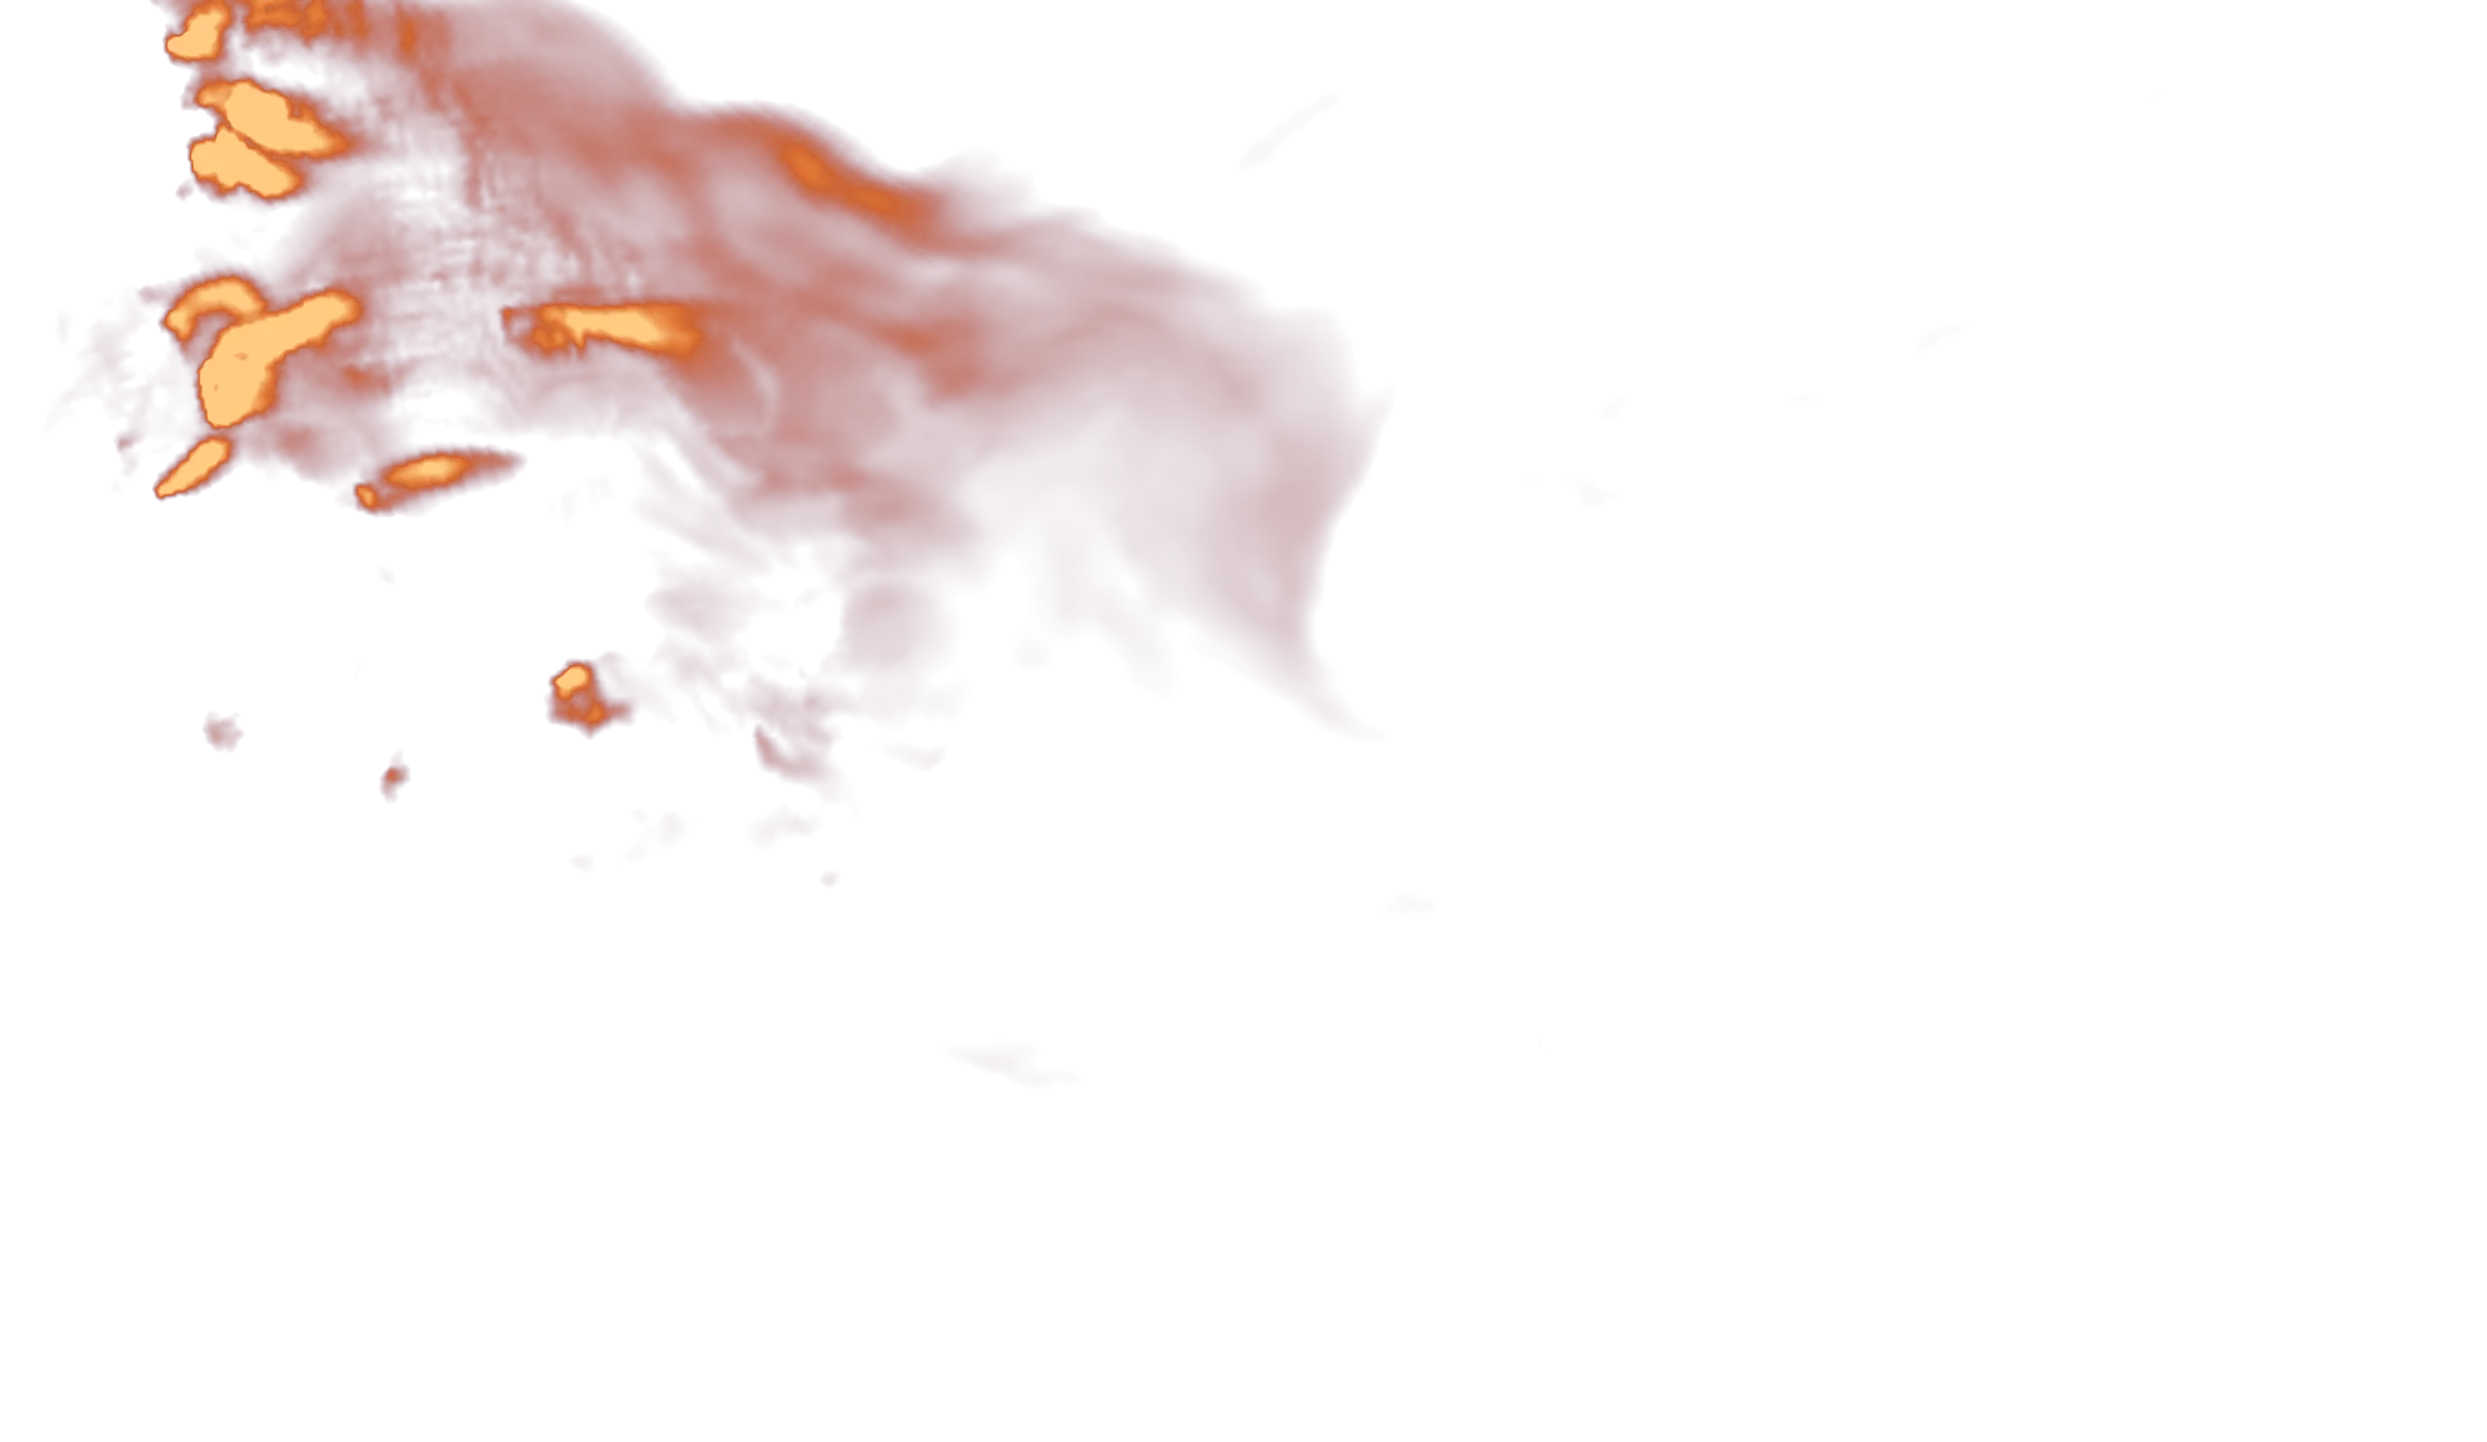
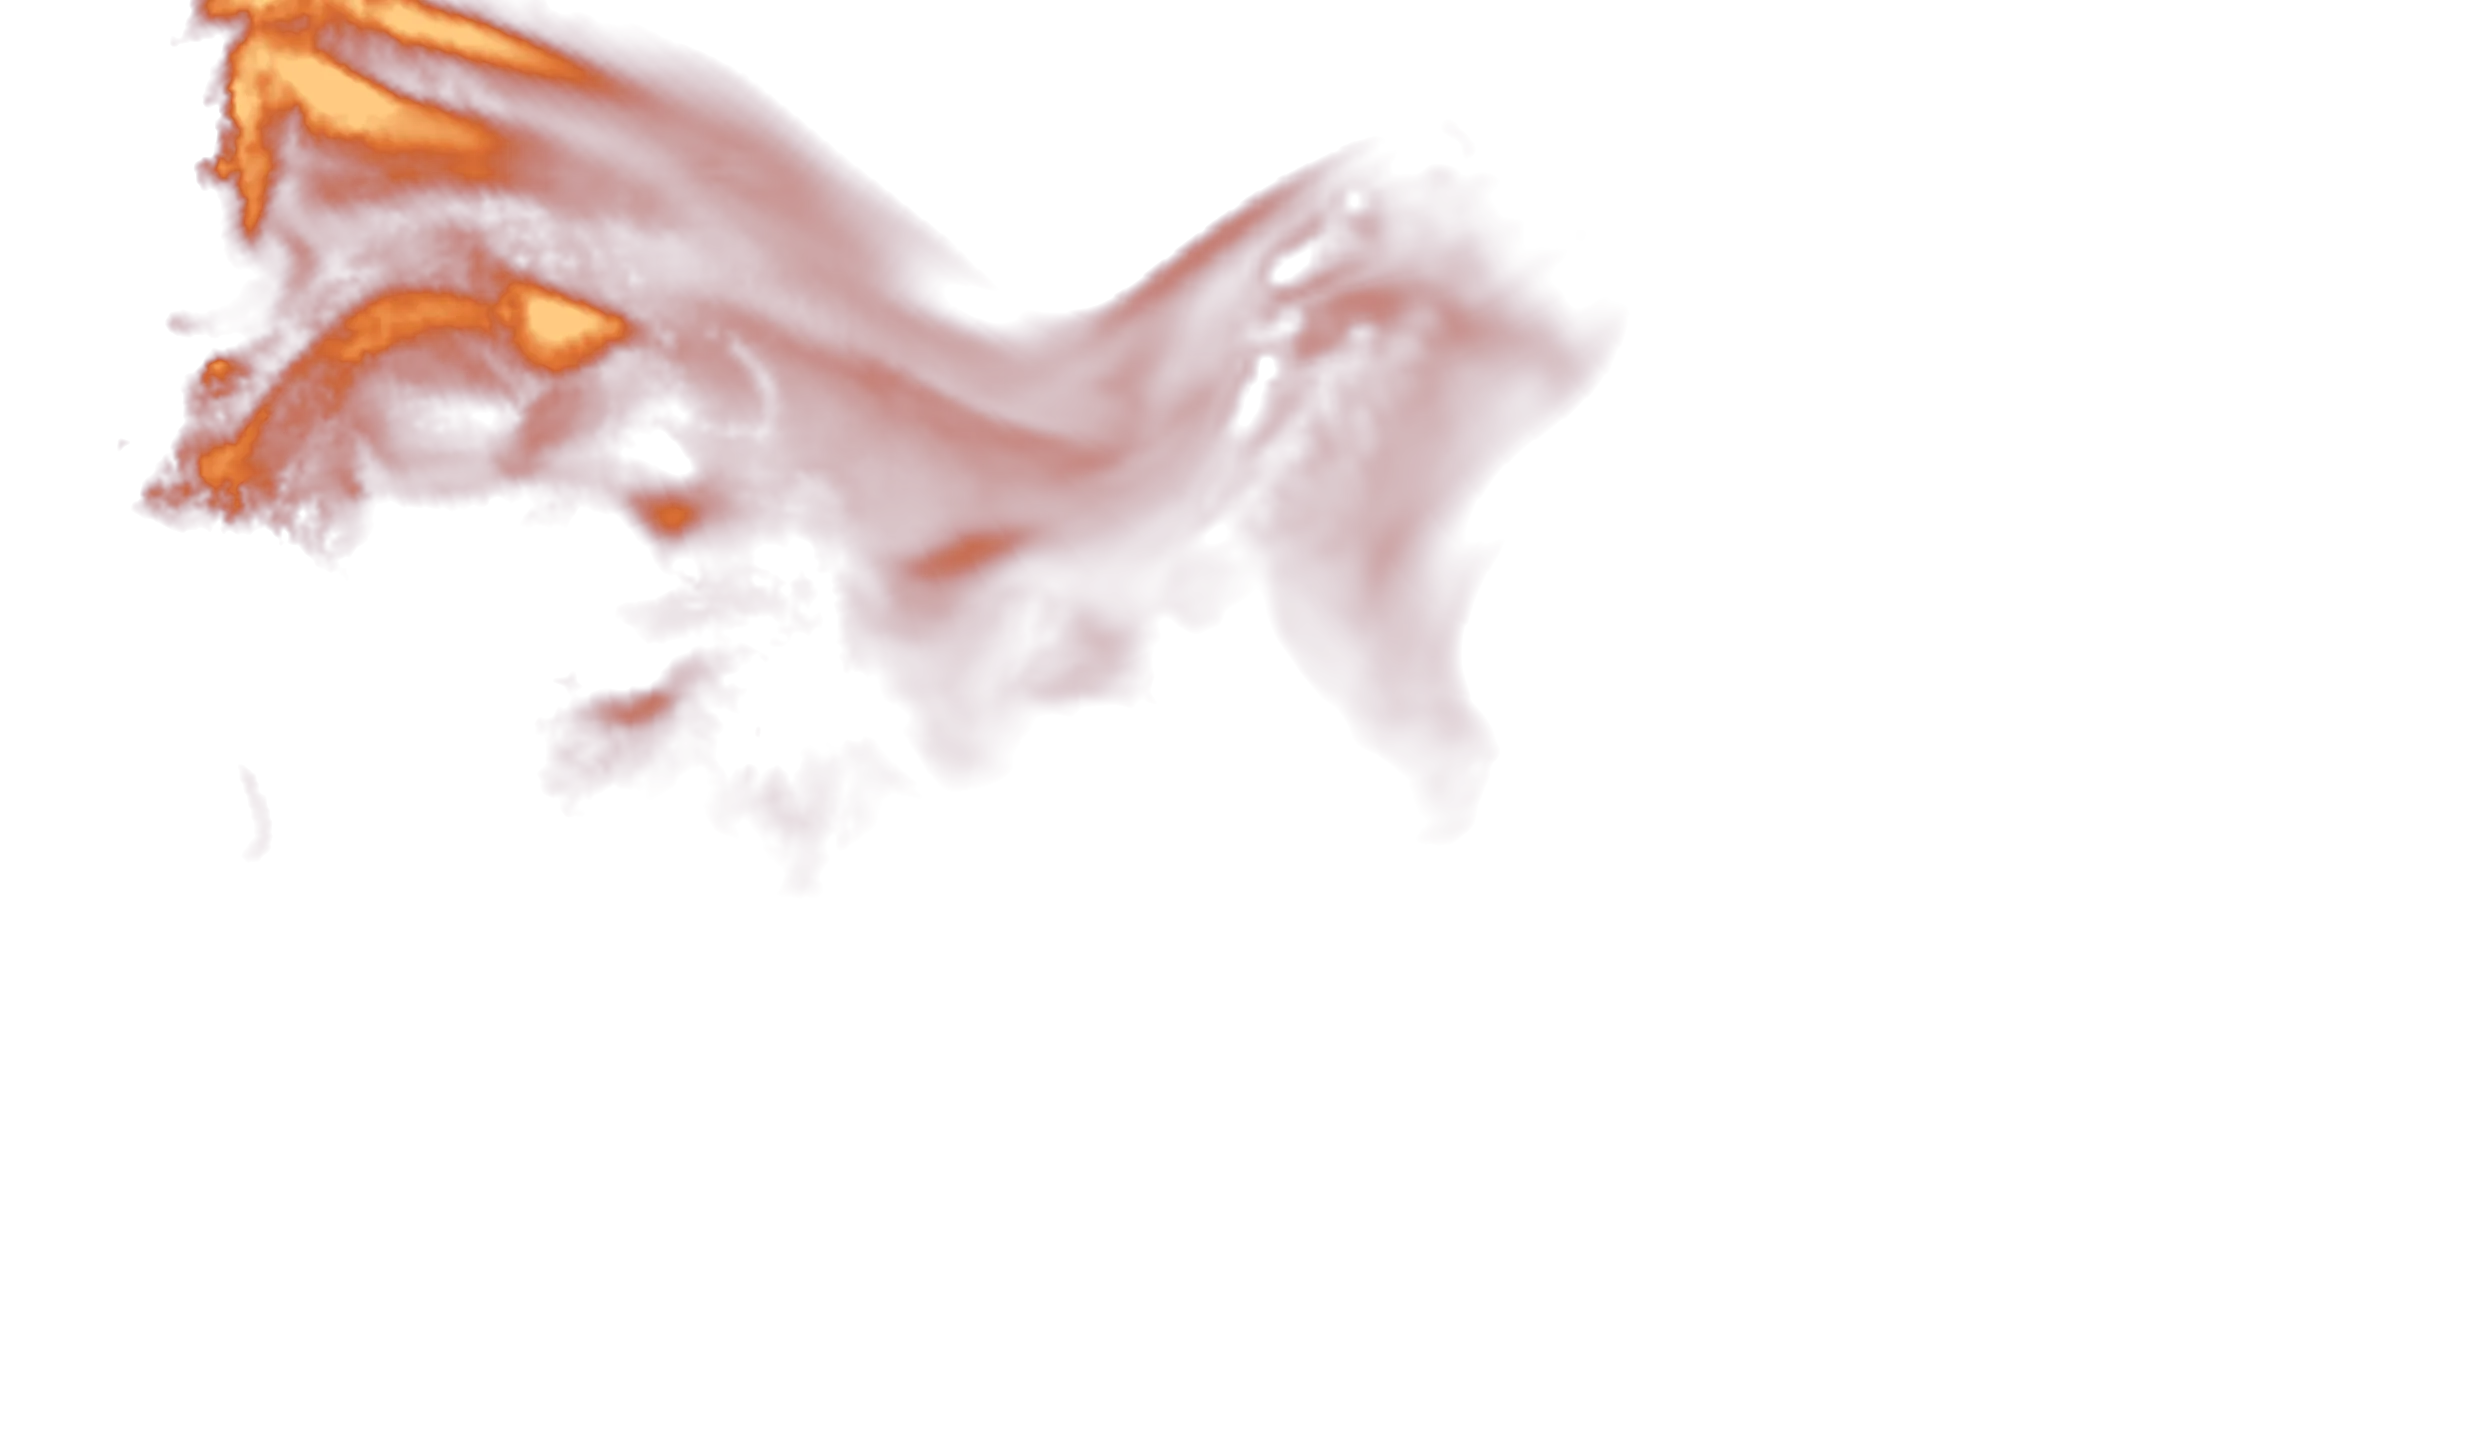
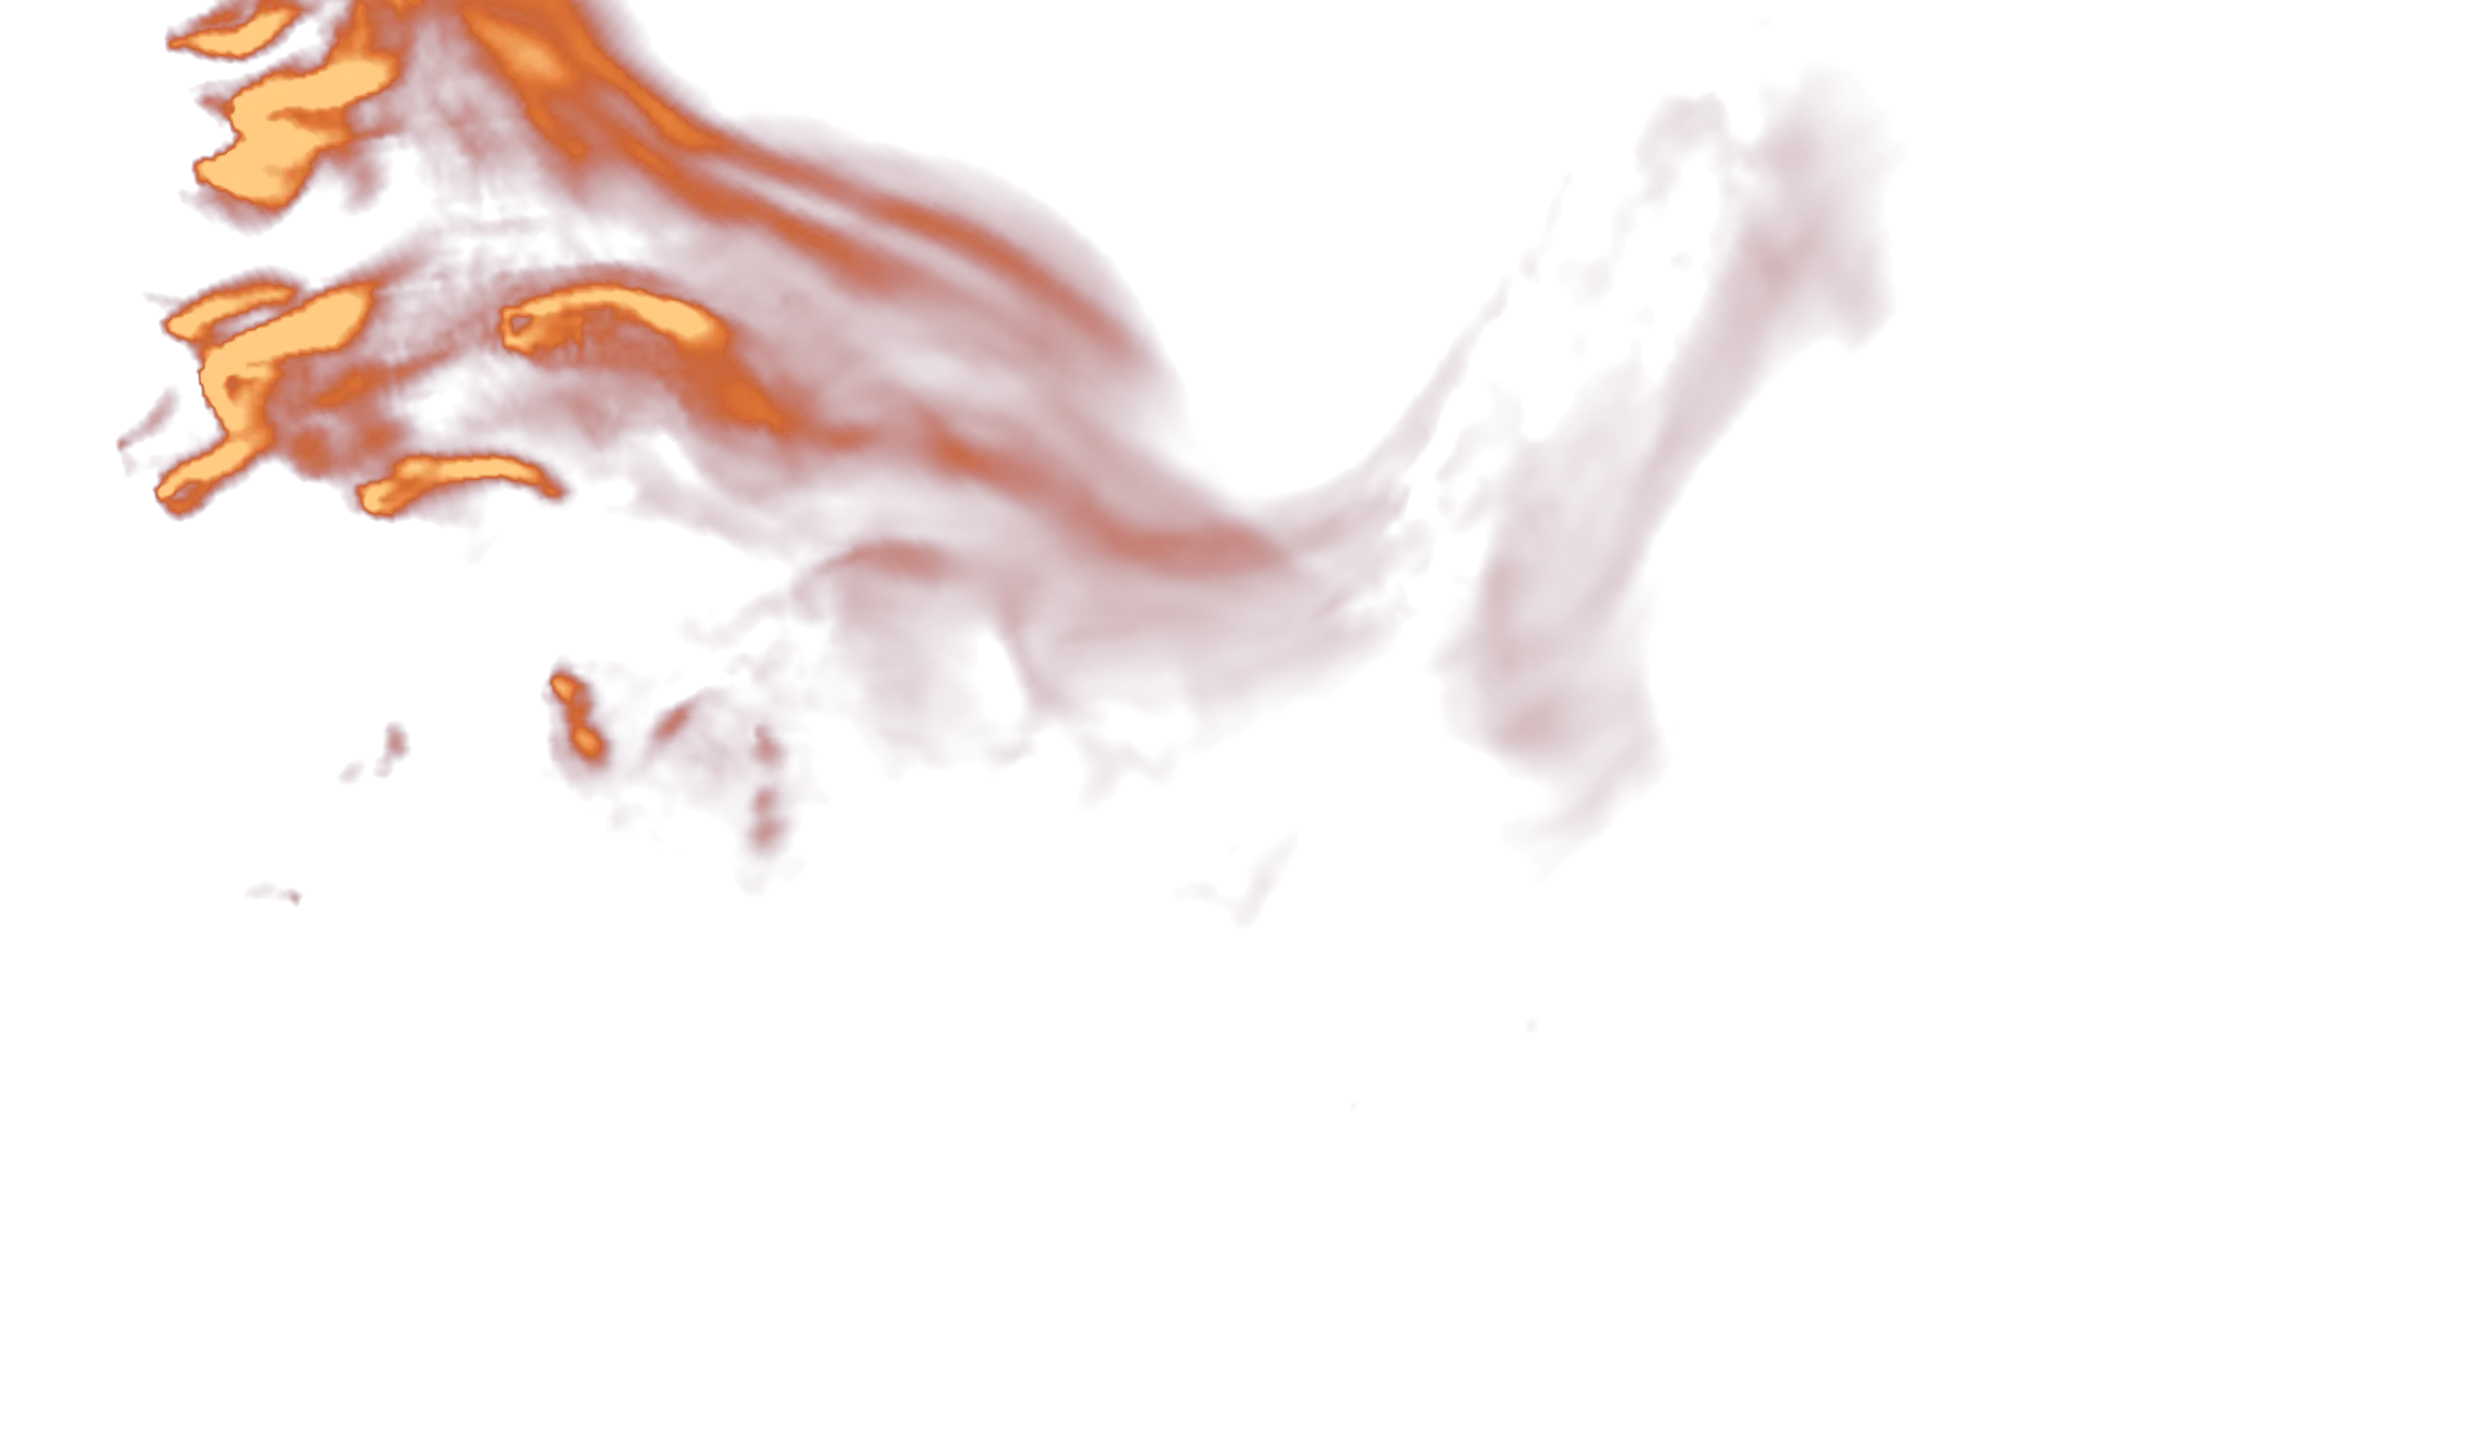
On the map, dark is clear air and bright orange is heavy smoke. The blue lines are the wind, showing which way it is pushing.
For air quality we use the US AQI — the same 0-500 scale on every weather app. Under 50 is fine. Over 100, sensitive people should take it easy. Over 150 affects everyone.
EPA breakpoint table, computed from surface PM2.5.
This is a forecast, not a measurement — the same as a rain forecast. It can be wrong. For official air quality readings and health advice, see AirNow.
Coming soon · iPhone
The whole picture, on your phone.
This site shows the next day, one place at a time. The app shows three days, everywhere you care about, and tells you before smoke gets there.
- 01Three days aheadSee exactly when smoke reaches you and when it lifts, hour by hour.
- 02Live firesWhere the fires actually are right now, so you know what is making the smoke.
- 03Wind forecastWhich way the air is moving, so you can see where the smoke goes next.
- 04On your Lock ScreenYour places at a glance. No app to open, no tapping around.
- 05A heads-up before it hitsA notification when smoke is forecast to reach somewhere you care about.
- 06No account, no trackingNo sign-up, no ads, no data collected. One purchase, yours forever.
One email when it ships. Nothing else, ever. Handled by Formspree — see privacy.